3.133.138.31
Climate anomalies and oscillations
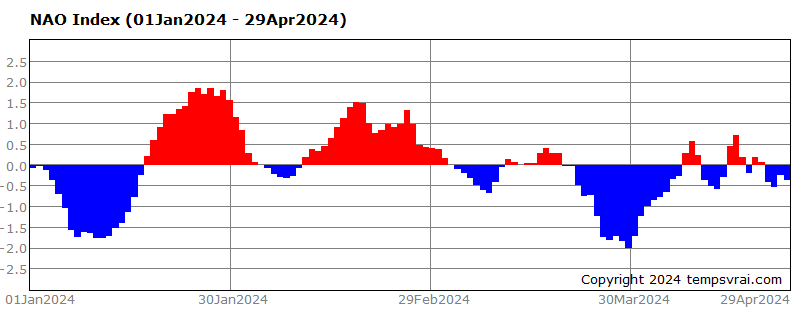
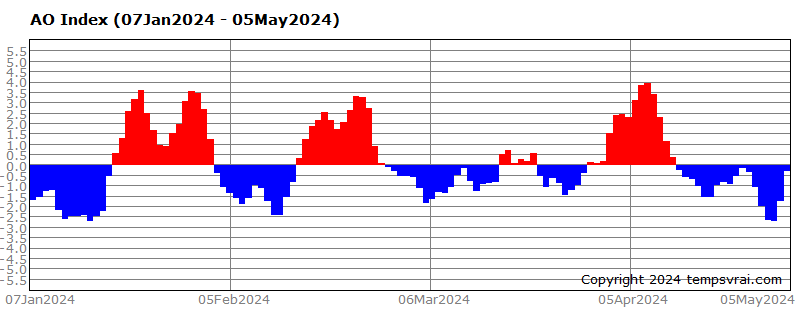
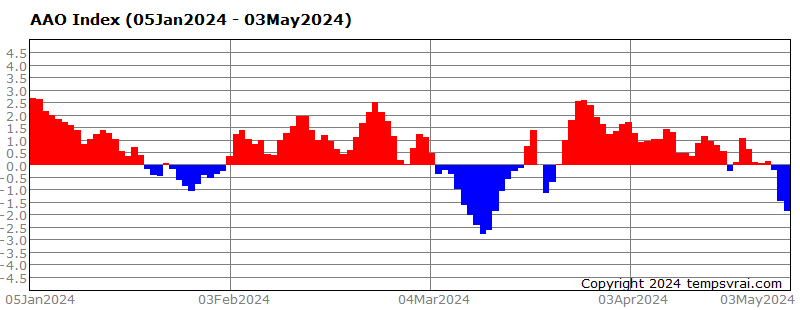
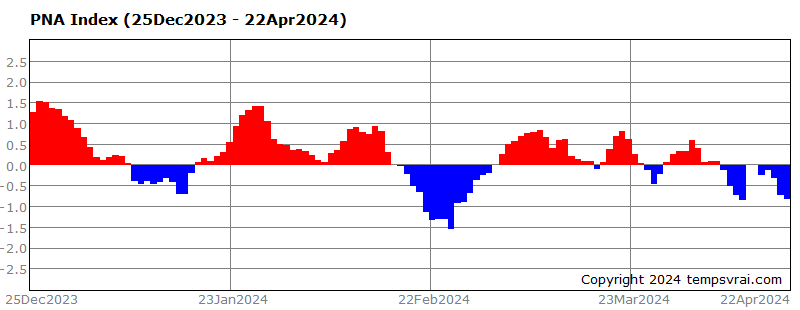
The following diagrams show an overview of several climate indeces (anomalies and oscillations) for the last month or years.
NAO Index
▸Long-term monitoring and more information
AO Index
▸Long-term monitoring and more information
AAO Index
▸Long-term monitoring and more information
PNA Index
▸Long-term monitoring and more information
ENSO Index (El Niño / La Niña)
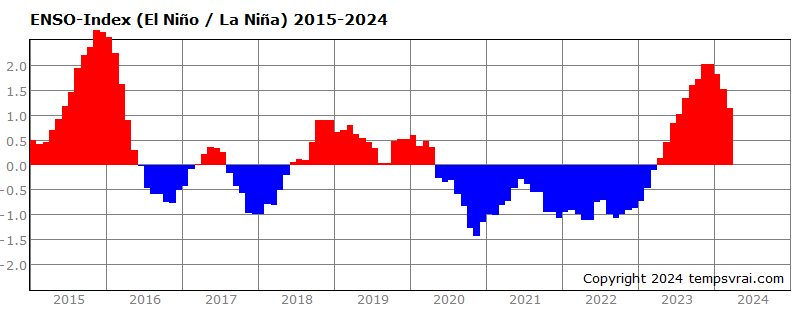 ▸Long-term monitoring and more information
SOI Index
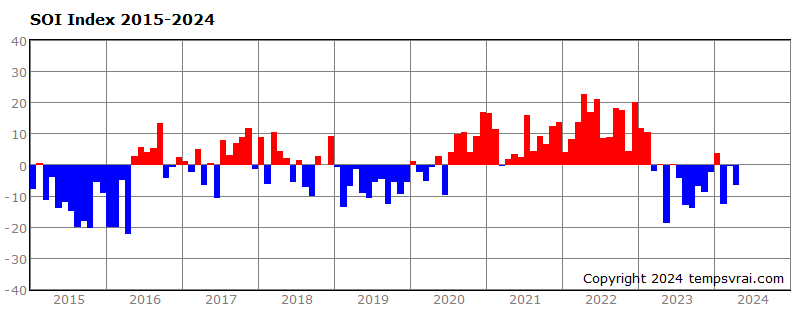
▸Long-term monitoring and more information
AMO Index
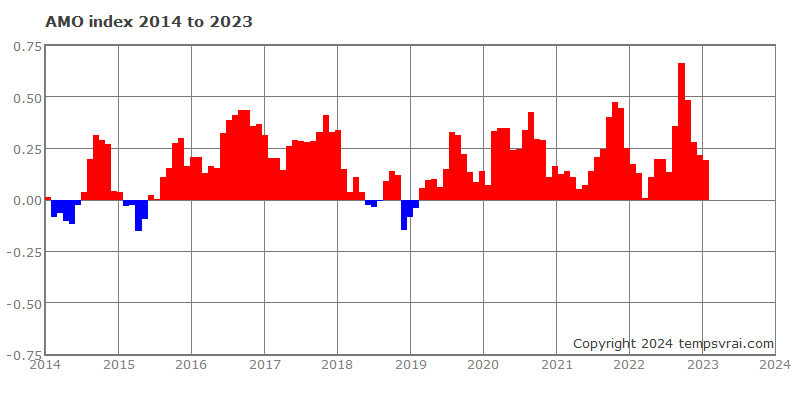
▸Long-term monitoring and more information
PDO Index
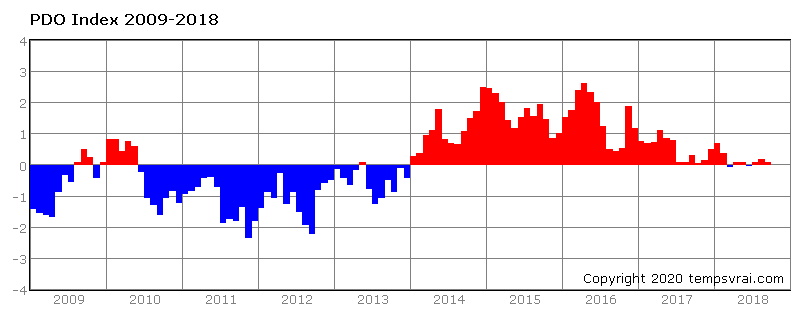
▸Long-term monitoring and more information
← Back
↑ Top of the page
MORE THEMES
weather.plus
P.O.Box 1206, 55280 Nierstein, Germany
Email: info@weather.plus
© tempsvrai.com 1992-2024
All rights reserved.
P.O.Box 1206, 55280 Nierstein, Germany
Email: info@weather.plus
© tempsvrai.com 1992-2024
All rights reserved.


