Global temperatures
The following data is based on the reference period 1901 to 2000. The following diagrams show the global average temperature as annual and monthly values, measured since 1880. The anomalies are based on the average from 1901 to 2000. The anomalies are separated by land and ocean plus by the northern and southern hemisphere. This represents the different trends of the global temperature for both hemispheres.
All data in degrees Celsius.
Source: National Centers for Environmental Information der NOAA (NCEI)
Previously, data from National Climatic Data Center der NOAA (NCDC) with the reference period 1901 to 2000 was used.
Global temperature anomalies 1880 to date

Climate anomalies of the last 14 months
May
+0.65
Jun
+0.76
Jul
+0.88
Aug
+0.97
Sep
+1.14
Oct
+1.12
Nov
+1.16
Dec
+1.07
Jan
+0.96
Feb
+1.07
Mar
+1.00
Apr
+0.97
May
+0.87
Jun
+0.91
Climate anomalies of the last 14 years
+0.32
+0.35
+0.37
+0.46
+0.61
+0.72
+0.64
+0.55
+0.67
+0.70
+0.55
+0.60
+0.87
+1.01*
Climate anomalies of the decades
- 90
-0.50
- 00
-0.51
- 10
-0.64
- 20
-0.59
- 30
-0.51
- 40
-0.38
- 50
-0.24
- 60
-0.30
- 70
-0.29
- 80
-0.22
- 90
-0.02
- 00
+0.09
- 10
+0.31
- 20
+0.51*
Observations since 1880
Land and ocean separated
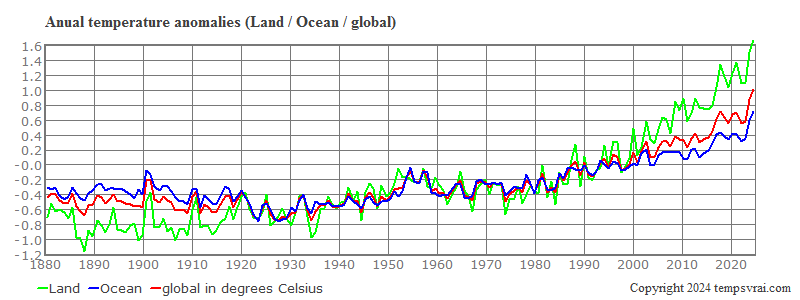
Fig.1: Annual anomalies of the global temperature:
Land green, ocean blue, global value red.
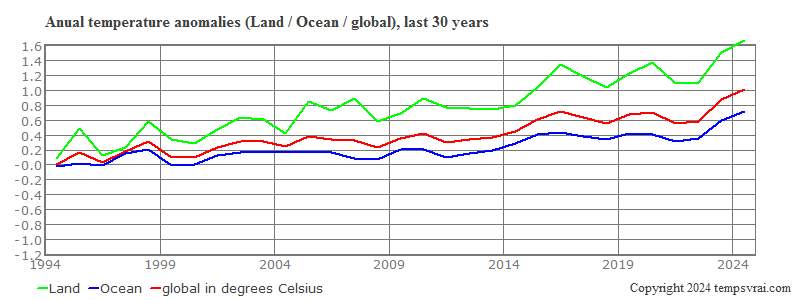
Fig.2: Annual anomalies of the global temperature:
Land green, ocean blue, global value red.

Fig.3: Monthly anomalies of the global temperature:
Land green, ocean blue, global value red.
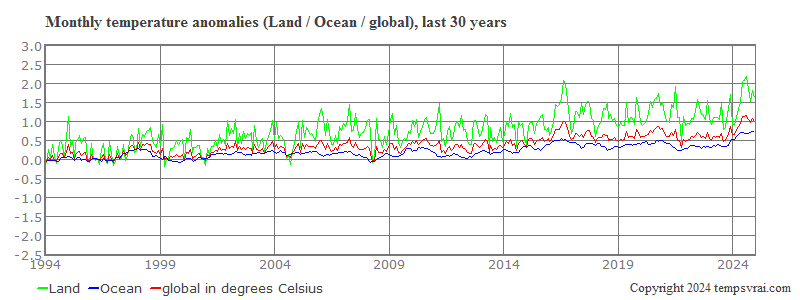
Fig.4: Monthly anomalies of the global temperature:
Land green, ocean blue, global value red.
Northern and southern hemisphere separated
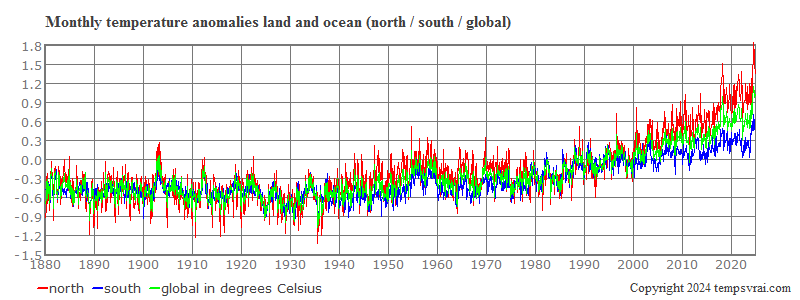
Fig.5: Monthly anomalies of the global temperature:
North red, south blue, global value green.
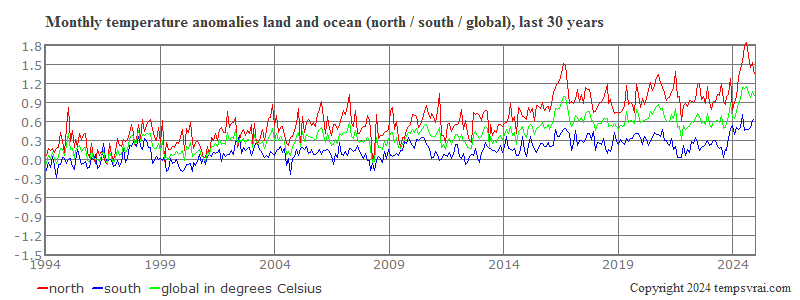
Fig.6: Monthly anomalies of the global temperature:
North red, south blue, global value green.
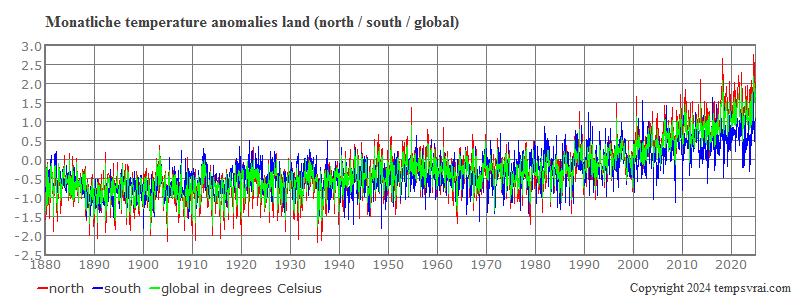
Fig.7: Monthly anomalies of the global temperature on land:
North red, south blue, global value green.
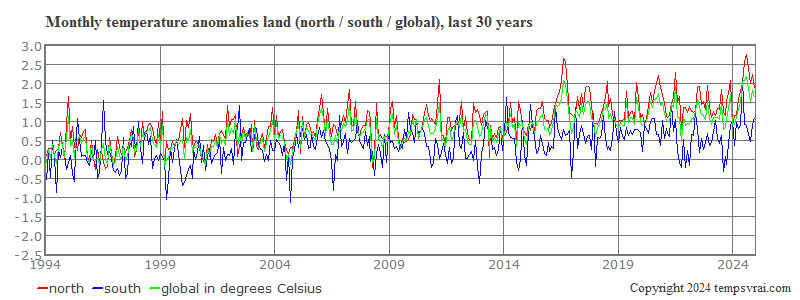
Fig.8: Monthly anomalies of the global temperature on land:
North red, south blue, global value green.
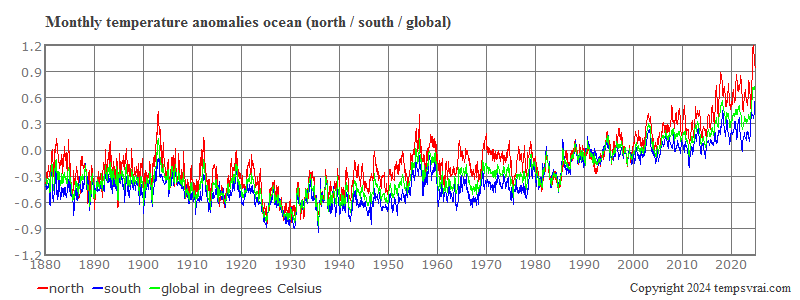
Fig.9: Monthly anomalies of the global temperature on the ocean:
North red, south blue, global value green.
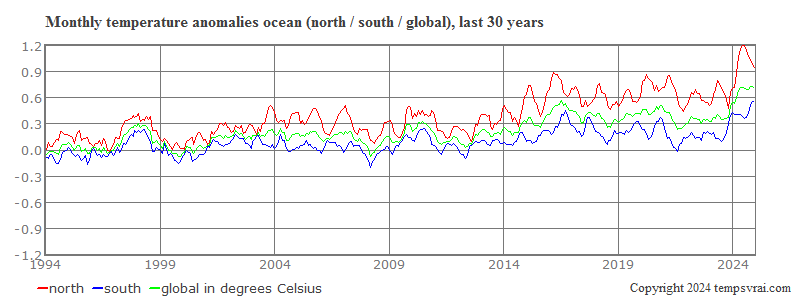
Fig.10: Monthly anomalies of the global temperature on the ocean:
North red, south blue, global value green.
MORE THEMES
P.O.Box 1206, 55280 Nierstein, Germany
Email: info@weather.plus
© tempsvrai.com 1992-2024
All rights reserved.


