18.116.13.113
Sea ice cover
Trends of all months
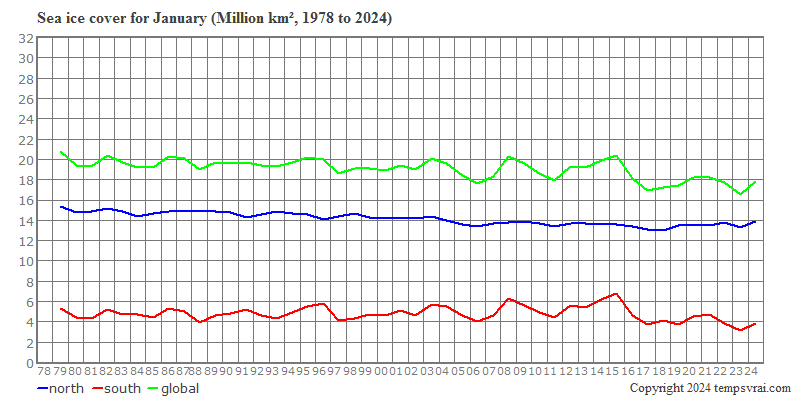
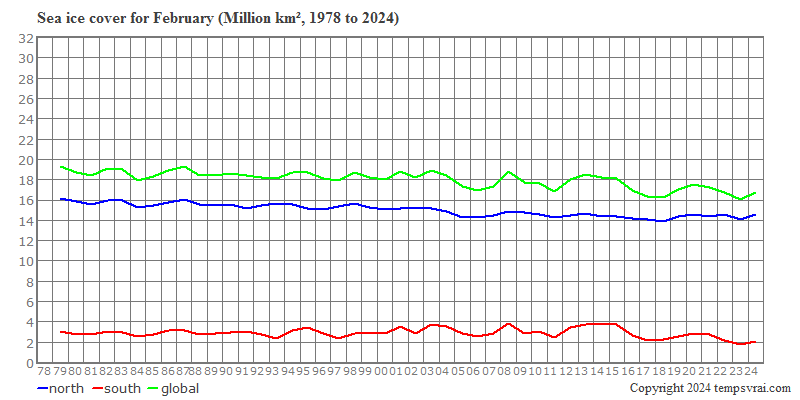
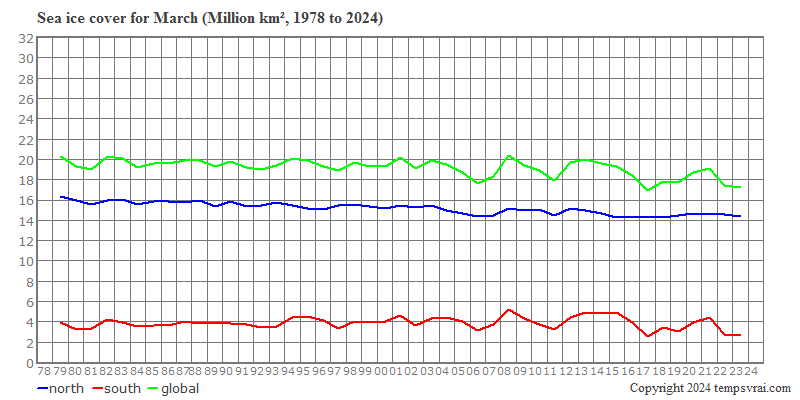
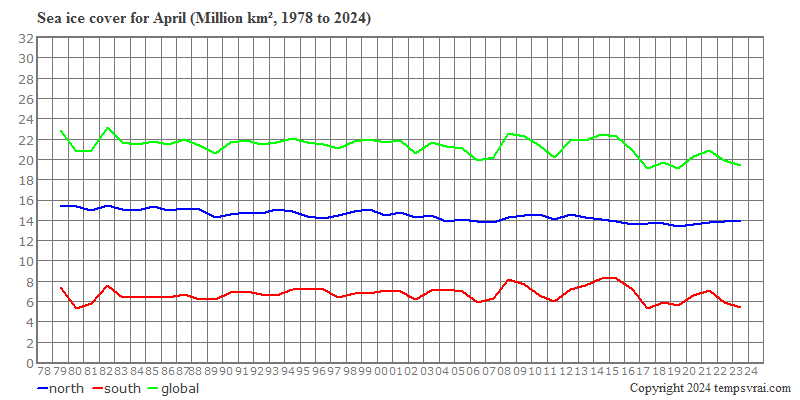
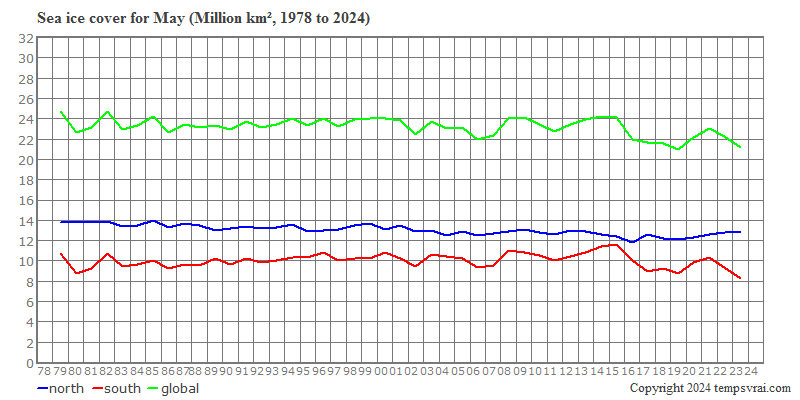
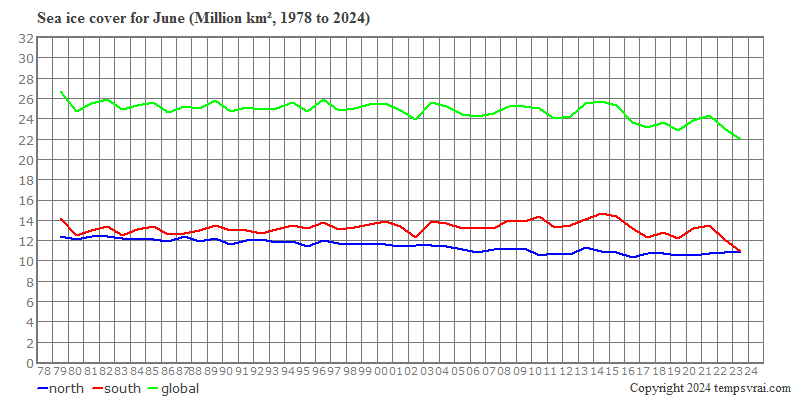
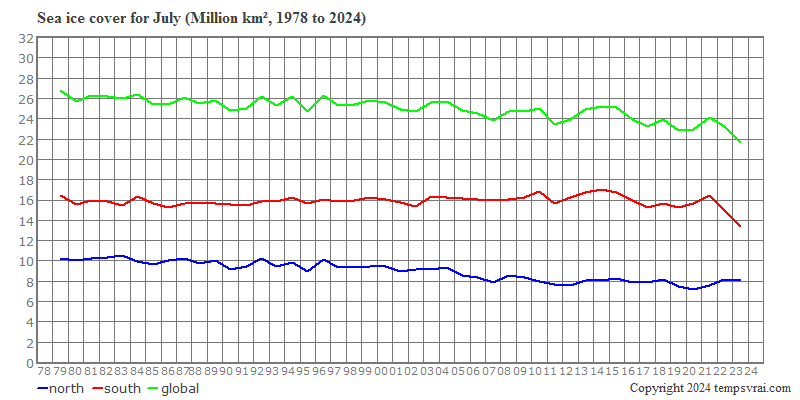
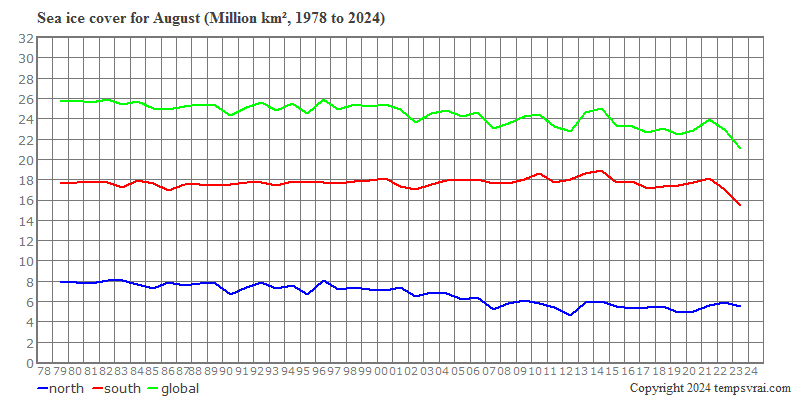
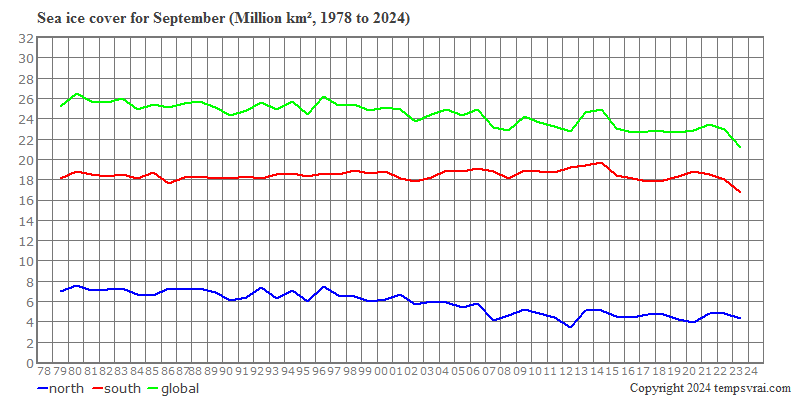
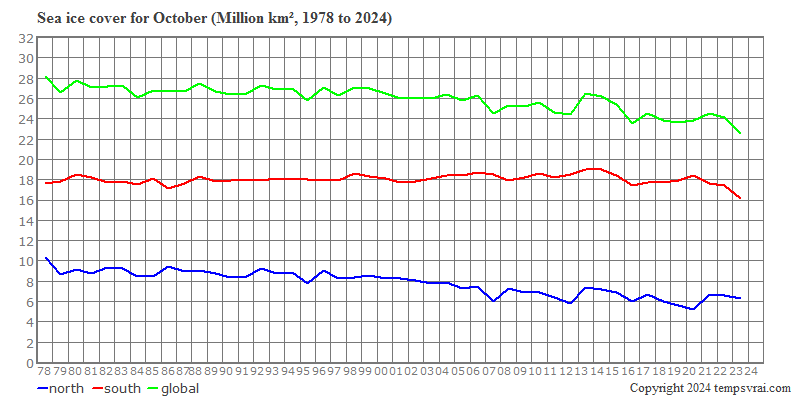
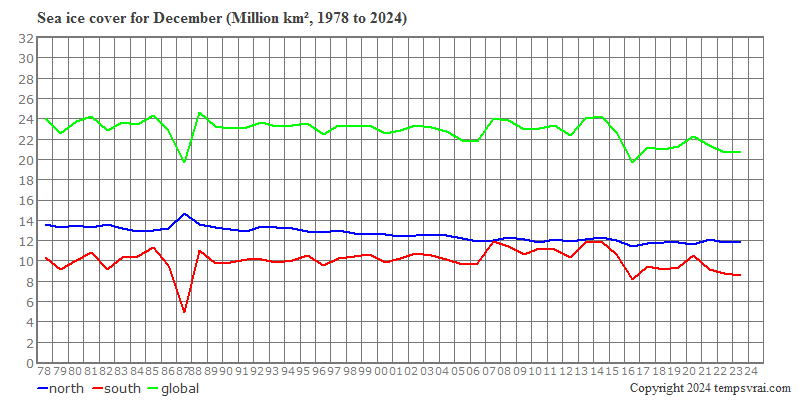
The following diagrams show the change in sea ice cover in the northern and southern hemisphere and as a global total. The trends for all 12 months are shown.
← Back
↑ Top of the page
MORE THEMES
weather.plus
P.O.Box 1206, 55280 Nierstein, Germany
Email: info@weather.plus
© tempsvrai.com 1992-2024
All rights reserved.
P.O.Box 1206, 55280 Nierstein, Germany
Email: info@weather.plus
© tempsvrai.com 1992-2024
All rights reserved.


