3.134.104.173
Ozone concentration of the atmosphere
The following charts are showing the ozone concentration of the atmosphere over the next few days.


0 DU
150 DU
300 DU
450 DU
600 DU
Cross sections
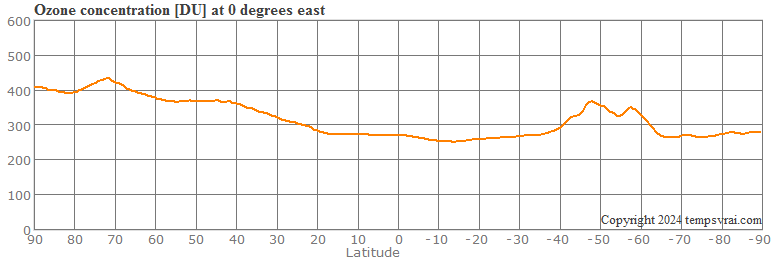
Atmospheric cross sections for different longitudes of the current day. The diagrams show the ozone concentration of the troposphere from the North Pole across the equator to the South Pole. In the polar regions, the lowest values are usually found. Regions with significantly reduced values are called ozone holes.
West:
East:


← Back
↑ Top of the page
MORE THEMES
weather.plus
P.O.Box 1206, 55280 Nierstein, Germany
Email: info@weather.plus
© tempsvrai.com 1992-2024
All rights reserved.
P.O.Box 1206, 55280 Nierstein, Germany
Email: info@weather.plus
© tempsvrai.com 1992-2024
All rights reserved.


