3.135.246.193
Current solar activity, sunspot index and sunspot numbers, Observation of sunspots and solar activity forecast, prediction of the solar activity. Sunspots in the northern hemisphere and sunspots of the southern hemisphere. sunspot numbers since 1700, daily sunspot numbers since 1818. solar activity diagram, sun cycle diagrams, strong sun cycle, weak sun cycle. historical solar activity, old solar activity, new definition of solar activity. Galileo Galilei and Wolf. forecast of the next sun cycle, forecast of the next solar cycle, comparing the sun cycles. 22 year Hale cycle, 11 year Schwabe cycle, magnetic polarity, 2300 - 2400 years Hallstatt cycle, 55 years Yoshimura, 85 years Gleißberg cycle, 180 - 210 years Seuss cycle, 180 - 210 years de-Vries cycle, 1470 years cycle of Bond- and Dansgaard-Oeschger events, intensity of the solar wind, solar activity of suns backside. Maunder Minimum, Dalton Minimum, Modern Maximum, Oort Minimum, Mittelalterliches Maximum, Wolf Minimum, Spoerer Minimum. Flares and aurora, space weather, Observatory, solar telescope, SDO, Satellites, brightness of the sun, geomagnetical storms. The Zeeman Effect describes the solar magnetic field as the driver of the sunspots. Royal Observatory of Belgium by the World Data Center.
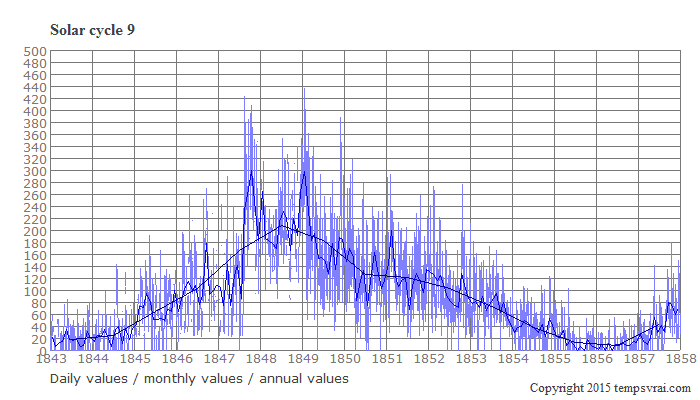
Solar cycle 9
The solar cycle 9 lasted from July 1843 to August 1860. The cycle has started with a minimum of 10.5 (monthly average) and reached a maximum of 131.6 (monthly average) in February 1848. The cycle has taken 150 months (12.5 years). The solar activity increased over a period of 55 months (4.6 yers) and declines during the following 94 months (7.9 years).
Diagram of solar cycle 9

Solar cycles archive:
The following table is listing the parameters of several parts of the solar cycles. The start, the length, and the duration of the particular phases are shown.| Note: | Cycles with a "p" (p13 to p1) are cycles before 1750. |
| Cycle | Start year | Minimum value | Year of the maximum | Maximum value | Increasing time | Decreasing time | Cycle length |
| p13 | 1610.8 | 1615.5 | 4.7 | 3.5 | 8.2 | ||
| p12 | 1619 | 1626 | 7 | 8 | 15 | ||
| p11 | 1634 | 1639.5 | 5.5 | 5.5 | 11 | ||
| p10 | 1645 | 1649 | 4 | 6 | 10 | ||
| p9 | 1655 | 1660 | 5 | 6 | 11 | ||
| p8 | 1666 | 1675 | 9 | 4.5 | 13.5 | ||
| p7 | 1679.5 | 1685 | 5.5 | 4.5 | 10 | ||
| p6 | 1689.5 | 1693 | 3.5 | 5 | 8.5 | ||
| p5 | 1698 | 1705.5 | 7.5 | 6.5 | 14 | ||
| p4 | 1712 | 1718.2 | 6.2 | 5.3 | 11.5 | ||
| p3 | 1723.5 | 1727.5 | 4 | 6.5 | 10.5 | ||
| p2 | 1734 | 1738.7 | 4.7 | 6.3 | 11 | ||
| p1 | 1745 | 1750.3 | 92.6 | 5.3 | 4.9 | 10.1 | |
| 1 | 1755.1 | 14 | 1761.4 | 144.1 | 6.3 | 5.0 | 11.3 |
| 2 | 1766.4 | 18.6 | 1769.7 | 193 | 3.3 | 5.8 | 9.0 |
| 3 | 1775.4 | 12 | 1778.3 | 264.2 | 2.9 | 6.3 | 9.3 |
| 4 | 1784.7 | 15.9 | 1788.1 | 235.3 | 3.4 | 10.2 | 13.6 |
| 5 | 1798.3 | 5.3 | 1805.1 | 82 | 6.8 | 5.4 | 12.3 |
| 6 | 1810.5 | 0 | 1816.3 | 81.2 | 5.8 | 7.0 | 12.8 |
| 7 | 1823.3 | 0.1 | 1829.8 | 119.2 | 6.5 | 4.0 | 10.5 |
| 8 | 1833.8 | 12.2 | 1837.2 | 244.9 | 3.3 | 6.3 | 9.7 |
| 9 | 1843.5 | 17.6 | 1848.1 | 219.9 | 4.6 | 7.8 | 12.4 |
| 10 | 1855.9 | 6 | 1860.1 | 186.2 | 4.2 | 7.1 | 11.3 |
| 11 | 1867.2 | 9.9 | 1870.6 | 234 | 3.4 | 8.3 | 11.8 |
| 12 | 1878.9 | 3.7 | 1883.9 | 124.4 | 5.0 | 6.3 | 11.3 |
| 13 | 1890.2 | 8.3 | 1894.0 | 146.5 | 3.8 | 8.0 | 11.8 |
| 14 | 1902.0 | 4.5 | 1906.1 | 107.1 | 4.1 | 7.4 | 11.5 |
| 15 | 1913.5 | 2.5 | 1917.6 | 175.7 | 4.1 | 6.0 | 10.1 |
| 16 | 1923.6 | 9.3 | 1928.3 | 130.2 | 4.7 | 5.4 | 10.1 |
| 17 | 1933.7 | 5.8 | 1937.3 | 198.6 | 3.6 | 6.8 | 10.4 |
| 18 | 1944.1 | 12.9 | 1947.3 | 218.7 | 3.3 | 6.9 | 10.2 |
| 19 | 1954.3 | 5.1 | 1958.2 | 285 | 3.9 | 6.6 | 10.5 |
| 20 | 1964.8 | 14.3 | 1968.8 | 156.6 | 4.1 | 7.3 | 11.4 |
| 21 | 1976.2 | 17.8 | 1979.9 | 232.9 | 3.8 | 6.8 | 10.5 |
| 22 | 1986.7 | 13.5 | 1989.8 | 212.5 | 3.2 | 6.8 | 9.9 |
| 23 | 1996.6 | 11.2 | 2001.8 | 180.3 | 5.3 | 7.1 | 12.3 |
| 24 | 2008.9 | 2.2 | 2014.3 | 116.4 | 5.3 | 5.7 | 11.0 |
| 25 | 2019.9 | 1.8 |
Downloading the data of the solar cycles: ▸solar-cycles.dat
← Back
↑ Top of the page
MORE THEMES
weather.plus
P.O.Box 1206, 55280 Nierstein, Germany
Email: info@weather.plus
© tempsvrai.com 1992-2024
All rights reserved.
P.O.Box 1206, 55280 Nierstein, Germany
Email: info@weather.plus
© tempsvrai.com 1992-2024
All rights reserved.


