18.97.14.91
Weather
Weather observations
Water temperatures
Wind scales
Storm glass
Global Weather
Regional temperatures
Extreme weather
Tropopause
Ozone
Climate of the months
Climate
Global temperatures
Climate average 1981-2010
Troposphere
Climate of the months
Oscillations
NAO Index
AMO Index
AO Index
AAO Index
PDO Index
PNA Index
ENSO Index / El Niño
SOI Index
Tropical storms history
Sealevel
Seaice cover
Snow cover
Sun
Current sunspots
Annual solar activity
Solar cycles
Solar activity since 1700
Historical solar activity
Predicting the sun activity
Solar irradiance
Sitemap
Co
nta
ct
About
▸
Global temperatures
▸
Climate average '81-'10
▸
Troposphere
▸
Climate of the months
▸
Oscillations
▸
NAO Index
▸
AMO Index
▸
AO Index
▸
AAO Index
▸
PDO Index
▸
PNA Index
▸
ENSO-Index / El Niño
▸
SOI Index
▸
Tropical storms history
▸
Sealevel
▸
Seaice cover
▸
Snow cover
Climate anomaly:
▸
October 2024: 1.06°C
Sunspots:
▸
09th Dec:
114
10th Dec: ca.
136
Climate of the months: Temperature (Weather history)
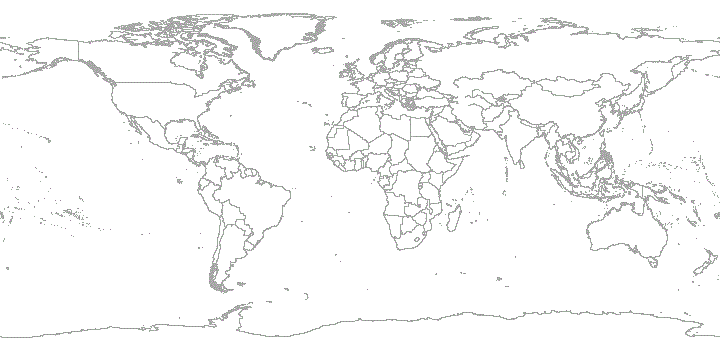
The following graphic shows the average of the temperature for November 2024.
◂
202410
◂
202311
←
Back
↑
Top of the page
MORE THEMES
WEATHER
GLOBAL WEATHER
CLIMATE
SUN
Weather observations
Extreme weather
Global temperatures
Current sunspots
Water temperature
Extreme heat
Troposphere
Annual solar activity
Storm glass
Extreme cold
Weather history
Solar activity since 1700
Station Niederlemp
Extreme storms
Climate of the decades
Historical solar activity
Station Ziegelhausen
Extreme rain
Climate anomalies
Predicting the sun activity
Wind scales
Tropopause
NAO Index
Solar irradiance
Ozon
AMO Index
AO Index
More on our sitemap...
weather.plus
P.O.Box 1206, 55280 Nierstein, Germany
Email: in
f
o@
wea
ther
.p
l
u
s
© tempsvrai.com 1992-2024
All rights reserved.